Home PowerPoint Content
How to Make Charts in PowerPoint
Create a basic graphic by setting it up as a Stacked Bar chart.
1.Open PowerPoint, select Layout from the Home tab and then choose the Blank type for your slide.
2.Blank Slide Layout in PowerPoint
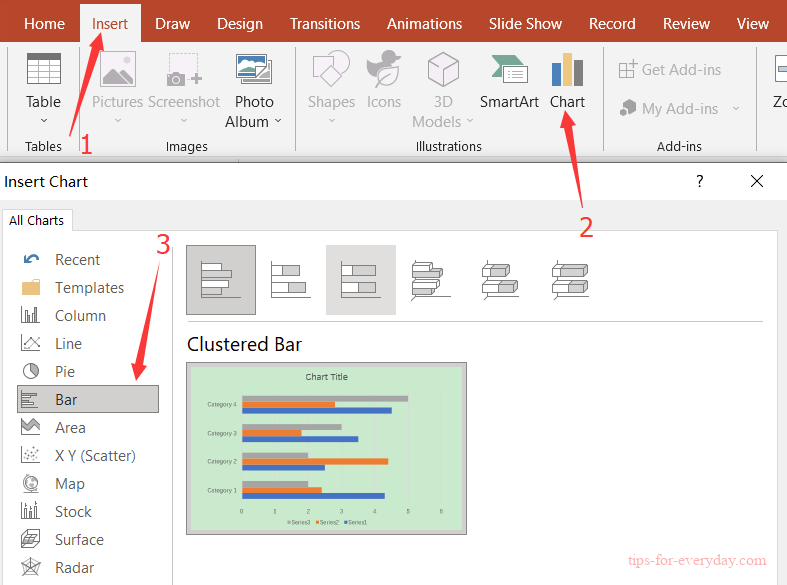
3.Go to the Insert tab.
4.Click on Chart from the Illustrations section.
5.Select the Bar category from the All Charts list.
6.Choose the Stacked Bar type for your Gantt chart.

After completing all the steps listed above, a standard chart like the one below will be inserted onto your PowerPoint slide, along with an Excel table pre-filled with placeholder data, which you can replace with your own.
